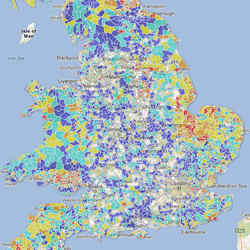
We currently use four measures:
1. Polar – Participation of Local Areas
This measure devised by HEFCE ranks each postcode in the UK into a quintile. Theoretically this should be the best measure but as it works on the student’s home postcode rather than the schools postcode it is less useful. It also lacks a useful tool to code postcodes en masse. Lovely maps though.
2. Income Deprivation Affecting Children Index (IDACI)
This measure ranks 33,000 Super Output Area. The DfE have a very simple tool that allows you to upload a .csv of postcodes and it returns a .csv with your postcodes and the IDACI score and ranking almost immediately. Thank you DfE. A drawback is that a school catchment area may not fully match the IDACI SOA that it is within. After getting the IDACI scores for our schools and for national schools, we then created qunitiles based on all state schools and then placed our schools into those quintiles based on their rankings.
3. GCSE 5+
The percentage of students at a school who gain 5 or more GCSEs at grade C or above including English and Maths is a mouthful, and a standard measure for school league tables. It is one indicator of how well the pupils at a school are performing. The drawback is that primary schools and 6th Form Colleges don’t get a score. We created quintiles and matched our schools to the national quintiles. The performance tables for English State Schools are here: http://data.gov.uk/dataset/performance_tables_in_england_-
4. Free School Meals (FSM)
Families recieving benefits can apply for Free School Meals which means the percentage of pupils claiming FSM at a school is normally a good measure of deprivation. The data is not readily available outside of England though. It comes on the same performance tables as the GCSE5+ data. We created the national quintiles and matched our schools to them.


