
We know anecdotally that participating in I’m a Scientist has a positive effect on students’ attitudes to science. Teachers tell us that their students were buzzing, and that they understood more about science. Students thank scientists in live Chats for an interesting lesson. They tell us that it is “better than Facebook”.
But, being data geeks, that isn’t good enough. We wanted to know just how much we were affecting the students. Were we affecting them all by the same amount? Girls, boys, year groups? Did being more active in the event mean a greater change in attitude?
Questions we ask students
Thanks in part to the pilot work by Robin Longdin (then a Science Communication masters student at UWE) we ask every student registering for I’m a Scientist a set of 4 questions:
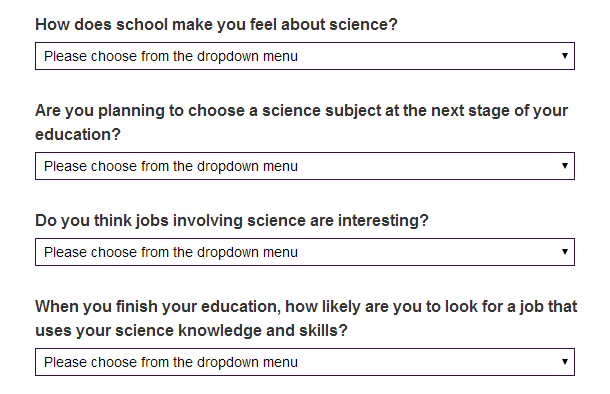
We also ask the same questions towards the end of the event and ask for the username so we can match against their initial answers, their gender, year group, zone and activity levels within the event.
Measuring attitudinal change
The important thing for us is not the answers they give, but the difference between the beginning and end of the event. We want to know if they feel differently after weeks of being exposed to scientists and their answers.
Each question had a five point answer scale. We intentionally wanted a neutral middle answer; we can’t expect students to all feel passionately about science. We then allocated a numerical value to each answer: 2 for the most positive, -2 for the most negative. We then subtract the starting answer value from the end of event value to give us a value for change in attitude for each of the four questions for each of the student who answered.
Do more active students see a greater change in attitude?
There is a lot of data generated and one of the challenges is to consolidate it into meaningful clusters. For example: what do we mean by levels of activity? Some students are lively in live Chats. Others ask a lot of questions. Some do both.
We looked at the 3 main types of activity: ASK, CHAT, VOTE and scored each student between 0 and 3 depending on how active they were. We then totalled the individual scores to give each student a score between 0 and 9 overall. That is the X-axis below.
The first thing to note is the overall trend: the more activity on the site, the more positive the change in attitude. Secondly, the change in attitude to the final question: “When you finish your education, how likely are you to look for a job that uses your science knowledge and skills?” is much lower than the other questions, and in fact sometimes negative even for those students who made the most of our erstwhile role models.
We need to investigate this further. It could be a flawed question? What does it really mean to 13 and 14 year olds. Do school students consider a PhD studentship to be a job? Are half our role models not helping with that question?
UPDATE:
We went back to the source data and found to our embarrassment that we had made a mistake and we were comparing the answers to the final question to the answers to the 3rd question. D’Oh! The good news for us is that when you use the right data, the story looks even better. Students emerge from I’m a Scientist feeling much more positive about jobs in science for themselves.
The greatest effect is on girls and Year 10 & 11 students
This graph shows the average change in attitude for six groups by question asked. It clearly shows that the event has the greatest effect on girls and on students in Years 10 & 11.
This is based on a total of 853 valid responses from students across three events from June 2013 to March 2014 in the UK. The n for the groups in the second chart are:
All: n=853
Girls: n=475
Boys: n=333
Primary: n=90
Years 7-9: n=589
Year 10 & 11: n=130
They don’t all add up to 853. Sometimes it is a group of girls and boys who register. We also had 21 sixth formers respond, but that is too small a sample to use. And sometimes the default “Please choose” answer remained. Yes, there are disproportionately more girls than boys, but more girls than boys participate.
Start a conversation!
Finally, we do this analysis so that we can better understand our event, but we publish it so that other practitioners can share in our knowledge. If you found this useful, or if you want to ask any clarifying questions, please contact us at support@imascientist.org.uk
