The I’m a Scientist family of projects connect young people with STEM professionals. Through asking questions and in-depth discussions students see that scientists, researchers, engineers, technicians, and other ‘experts’ are normal people with hobbies, interests, and lives outside of work. They develop rapport with scientists and come to see STEM as something for them.
Though all of our activities are available without charge to all UK state-maintained schools, we have developed criteria to be able to provide preferential access to schools which get fewer opportunities.
What is a priority school?
Schools are prioritised by their location, and by a widening participation proxy. Highest priority is given to schools that are both a widening participation school, and are in a priority location.
Underserved or distant schools
In our experience, the longer it takes for a researcher to reach a school, the less likely students at that school are to have visits from researchers. We carried out some research and found that schools which are more than 30 minutes drive from a major research HEI were half as likely to receive a visit from a STEM professional, as those within 15 minutes drive.
Read about our research on the effect of school location ❯
Schools that are further than 30 minutes drive from a major research HEI are considered to be distant or underserved, and we prioritise access for these schools.1
Widening participation schools
Traditional STEM engagement activities tend to reach schools that are better resourced.
“The most socio-economically disadvantaged students were two and a half times less likely to study Triple Science compared to the most advantaged.”
Aspires 2 2
“Young people from low-income families may start at a disadvantage, as they have not had the same access to knowledge and experience of HE and STEM-related forms of capital. They may receive less encouragement and support from key adults to apply and, importantly, the financial and social risks and costs of participation are disproportionately high for these young people. For instance, the risks of debt and ‘failure’ are much higher because they do not have the financial, social and cultural ‘safety nets’ of their more affluent peers. For these young people, not pursuing a STEM degree trajectory can constitute a pragmatic, rational strategy for managing disproportionate risk.”
Aspires 3 3
As there is no standard definition of a “widening participation school”, we use data on the proportions of students eligible for either free school meals (FSM), Pupil Premium (PP6), or — in Scotland and Wales — pupils living in areas with high indices of multiple deprivation (SIMD and WIMD).
Access is prioritised for schools with the highest proportions — quintiles 4 and 5 — of students eligible for free school meals, Pupil Premium, or living in areas with high indicies of multiple deprivation in Scotland and Wales.
We report on participating schools in each quintile.
Additionally, priority is always given to further education colleges, SEND and special schools, and PRUs.
Funder priorities
In all cases we first allocate places according to the priorities of our funding partners. Though our grant applications will generally set targets and prioritise places for the underserved and widening participation schools discussed above.
Find out more about becoming a funding partner ❯
School distribution
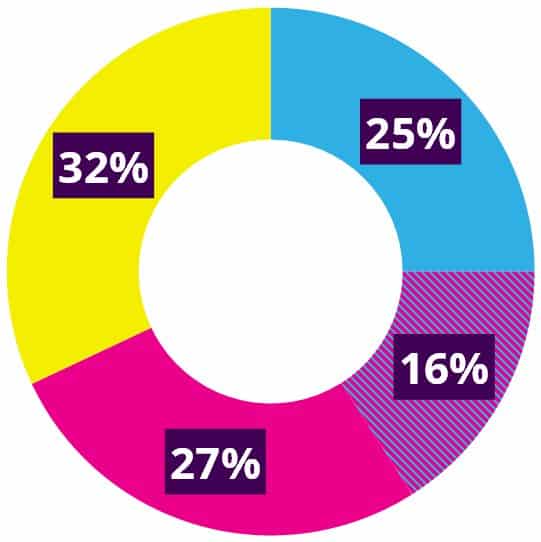
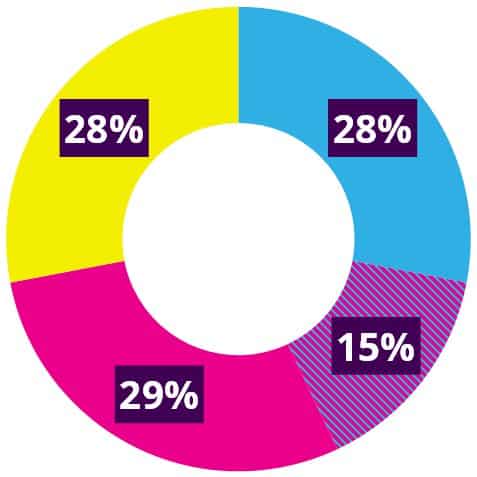
Nationally, 68% of schools are priority schools, with 41% being widening participation schools, and 43% being distant from HEIs. 16% of schools are both widening participation schools, and distant from HEIs. 72% of schools that have taken part in IAS in 2022/23 and 2023/24 are priority schools; 43% are widening participation participation schools, and 44%, distant from HEIs.

What data do we use?
Underserved or distant schools
Thanks to iGeolise we have a database of how long it takes to reach a school from the nearest major research HEI (based on travel by car at 9:00 am on a Monday morning).
Widening participation schools
School quintiles are calculated based on the percentage of pupils either eligible for FSM or PP6; or the percentage of pupils living in the 20% most deprived data areas of the Scottish or Welsh Indices of Multiple Deprivation. Schools with the highest quintiles (4 and 5) are considered priority schools.
- England: WP quintiles are based calculated by the percentage of pupils eligible for FSM 4 or PP6 5; whichever is higher.
- Northern Ireland: WP quintiles are based calculated by the percentage of pupils eligible for FSM.6
- Scotland: WP quitiles are calculated by the percentage of pupils living in the 20% most deprived data areas of the Scottish Indicies of Multiple Deprivation.7
- Wales: WP quintiles are calculated by the percentage of pupils living in the 20% most deprived data areas of the Welsh Indicies of Multiple Deprivation.8
Select to show/hide data tables
As policies vary between countries and school phases, quintiles are calculated separately for each country, and for each school phase.
Percentage figues given are rounded.
England: School quintiles for percentage of pupils eligible for free school meals and Pupil Premium (Summer 2023) 4,5
| Quintile | FSM: Primary | FSM: Secondary | FSM: Mixed or All through | PP6: Primary | PP6: Secondary |
|---|---|---|---|---|---|
| Q5 | ≥ 36% | ≥ 33% | ≥ 39% | ≥ 38% | ≥ 48% |
| Q4 | ≥ 23% | ≥ 24% | ≥ 30% | ≥ 25% | ≥ 34% |
| Q3 | ≥ 15% | ≥ 17% | ≥ 22% | ≥ 16% | ≥ 24% |
| Q2 | ≥ 9% | ≥ 12% | ≥ 14% | ≥ 9% | ≥ 14% |
| Q1 | < 9% | < 12% | < 14% | < 9% | < 14% |
Northern Ireland: School quintiles for percentage of pupils eligible for free school meals (Summer 2023) 6
| Quintile | Primary | Secondary |
|---|---|---|
| Q5 | ≥ 39% | ≥ 38% |
| Q4 | ≥ 27% | ≥ 31% |
| Q3 | ≥ 20% | ≥ 23% |
| Q2 | ≥ 14% | ≥ 12% |
| Q1 | < 14% | < 12% |
Scotland: School quintiles for percentage of pupils living in 20% most deprived data zones (SIMD Q1) (Summer 2023) 7
| Quintile | Primary | Secondary | Mixed or all through |
|---|---|---|---|
| Q5 | ≥ 49% | ≥ 44% | ≥ 19% |
| Q4 | ≥ 17% | ≥ 26% | |
| Q3 | ≥ 14% | ||
| Q2 | ≥ 2% | ||
| Q1 | > 17% | > 2% | > 19% |
Wales: School quintiles for percentage of pupils living in 20% most deprived data zones (WIMD Q1) (2022) 8
| Quintile | Primary | Secondary | Mixed or All through |
|---|---|---|---|
| Q5 | ≥ 43% | ≥ 38% | ≥ 41% |
| Q4 | ≥ 12% | ≥ 22% | ≥ 24% |
| Q3 | ≥ 12% | ≥ 9% | |
| Q2 | ≥ 3% | ||
| Q1 | < 12% | < 3% | < 9% |
1 Independent schools, and schools in London (in the following postcode areas) are not considered to be distant, even where the travel time by road is greater than 30 minutes. (Excluded postcode areas: BR, CM, CR, DA, E, EN, HA, IG, KT, N, NW, RM, SE, SM, SW, TW, UB, WD, and W)
2 “Aspires 2 Executive Summary: Young people’s science and career aspirations, age 10–19” (p.7) [discovery.ucl.ac.uk/id/eprint/10092041/1/Moote_9538%20UCL%20Aspires%202%20Exec%20Summary.pdf]
3 “Aspires 3: Young people’s STEM Trajectories, Age 10–22” (p.34) [discovery.ucl.ac.uk/id/eprint/10181968/1/ASPIRES3%20Main%20Report.pdf]
4 School data for pupils eligible for free school meals in England: [get-information-schools.service.gov.uk/Downloads]
5 School data for pupils eligible for Pupil Premium in England: “Pupil premium allocations 2022 to 2023 (updated March 2023)” [gov.uk/government/publications/pupil-premium-allocations-and-conditions-of-grant-2022-to-2023]
6 School data for pupils eligible for free school meals in Northern Ireland: “School enrolments – school level data 2022/23” [education-ni.gov.uk/articles/school-enrolments-school-level-data]
7 School data for pupils living in deprived areas of the Scottish Index of Multiple Deprivation: “School level summary statistics 2023” [gov.scot/publications/school-level-summary-statistics/]
8 School data on pupils living in deprived areas of the Welsh Index for Multiple Deprivation: “Percentage of primary, middle, and secondary school pupils who have a home postcode in the 20% and 40% most deprived areas of the Welsh Index for Multiple Deprivation (WIMD) 2019, at February 2022” [gov.wales/ad-hoc-statistical-requests-12-23-september-2022]


