Every so often we take all our data, and look at how schools use the site; looking at how visitors access the site and how much that has changed in the past couple of years. This post is for data up to 2015. See also data for 2014, 2018 and 2019.
We’ve made a lot of changes in recent events, especially when it comes to registering accounts and using the site on mobile devices. We now pre-register all teachers and students, giving them usernames and passwords, so they can start asking questions immediately.
We can assume that the student visitors give a fair reflection of the general school IT facilities and system capabilities.
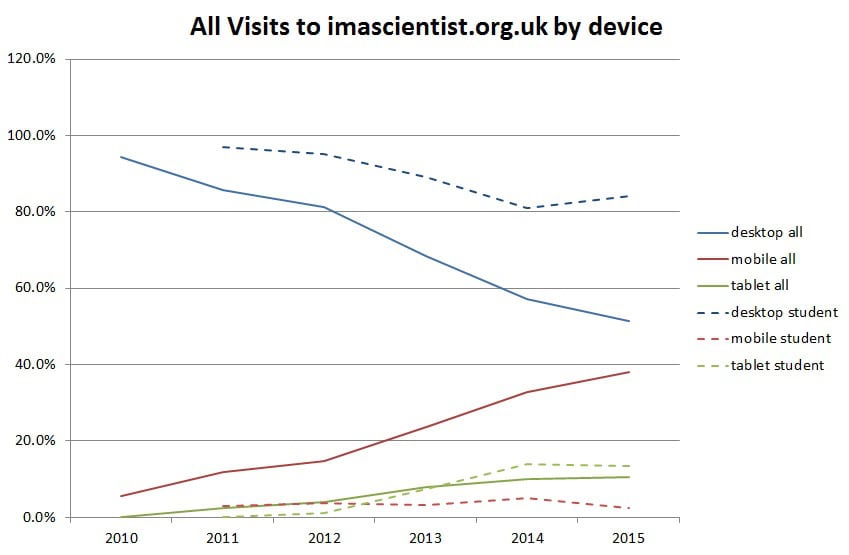
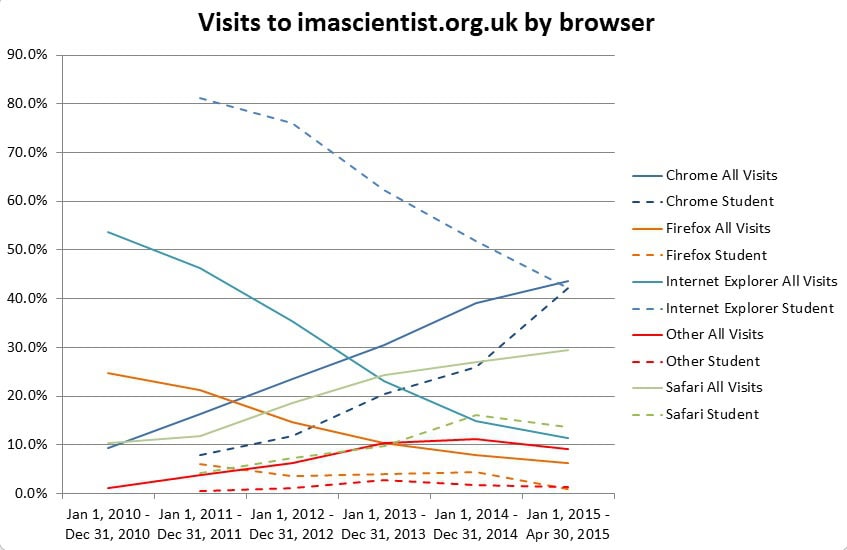
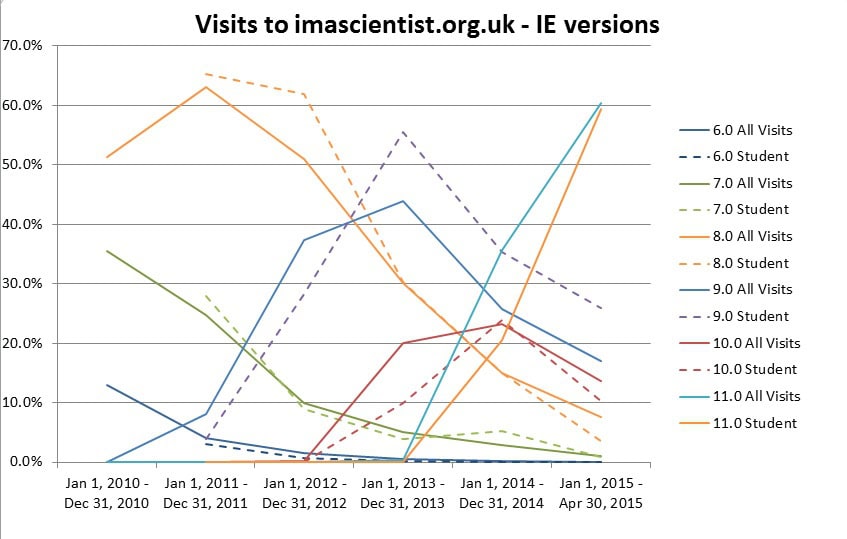
The graphs show the student data represented by dashed lines.
We saw last year, that visits from mobile and tablet devices were increasing. and no surprise they continue to grow, while desktop usage drops slightly. For student tablet users there is little difference in content visited when compared to student desktop users.
We’re currently right in the middle of an overhaul to make the site more responsive and mobile friendly- which should make the user experience a lot smoother for all users. Allowing students who use tablets and mobiles the same experience as desktop users.
If desktop usage is going down somewhat, it’s unsurprising that Internet Explorer is also sinking, with Chrome taking a the lead and Safari jumping up (a lot of tablets and mobile devices being Apple products, where the default browser is Safari). The rise in other browsers will be down to mobile and tablet browsers using Android, Blackberry and Opera.
And finally the bane of web designers and developers lives.. The old versions of Internet Explorer. A collective sigh of relief, IE6 has finally drifted out of favour (available since 2003!!!!), IE7 is on the out, IE8 is dropping, as is IE9, even IE10 is dropping.. But IE11 has taken a big leap. Understandably when a new version is released, it will lead to older versions not being used, but the jump in the graph is still quite dramatic, compared to last years.


