Evaluation

What do students ASK about? [REDIRECT]

Our events generate huge amounts of interesting data, which we know contains all sorts of valuable insights. When there’s so much of it, it can take a while to work out how to make best use of it. One example of this is thematic analysis of the questions students post in ASK. Over the years of running the event we’ve developed a pretty good sense of the types of things students ask about and will always showcase great examples of questions. Converting that into a systematised, reportable analysis is more difficult, but can be done. So, we have developed a system for coding questions based on a set of themes that students often ask about, and after some trials in March, we’ve applied it to all zones in the June event (read the latest reports here). At their broadest level, most student questions fall into one of three areas: questions about the … Continue reading

Posted on July 17, 2017 by in Evaluation, News | 1 Comment

Gender differences in online engagement

“I thought scientists just looked like they do in the film Flubber and experimented on aliens or weird stuff but when I found out you liked Taylor Swift I realised you are more down to earth and not like mad scientist :)” – Student, November 2015 I’m a Scientist is about connecting pupils with real scientists. Something we want to find out is what effect this interaction has on different groups of students. Recent research by the Institute of Physics has done just that. The IOP has carried out an independent research project to gain an insight into the behaviour and attitudes of boys and girls who do I’m a Scientist. As part of their Improving Gender Balance project, the IOP funded two zones: Terbium Zone and Osmium Zone. The researchers anonymously surveyed the students’ attitudes to science and scientists before and after the event. We also provided them with all the student’s interaction … Continue reading

Posted on October 21, 2016 by in Evaluation, News | Comments Off on Gender differences in online engagement

Careers Zone

The Careers Zone is a new zone where students attending a careers fair at their school can talk online with a range of scientists and engineers, based all over the UK. A lot of the time, school careers fairs are only able to accommodate businesses and organisations in the local area. We want to give students an opportunity to ask their questions to experts working in a multitude of areas, letting them see how diverse STEM careers can be. In turn, STEM professionals can pass on honest advice and information, showing students what it’s like to be a real engineer or scientist. We selected a range of experts to take part, including a deep-sea researcher, a scientist for the NHS and a Jaguar Land Rover engineer. There were also engineers who had gotten into their professions through an apprenticeship. It was important for us to let students see the different … Continue reading

Posted on October 6, 2016 by in Evaluation, News, Project News | Comments Off on Careers Zone

Osmium Zone – I’m a Scientist, not just for scientists?

The Institute of Physics collaborated with I’m a Scientist to create the Osmium Zone that included four people who had studied physics and now worked outside of academia and research, plus one physics researcher, to demonstrate the diversity of STEM careers to school students.

The goal was to make students aware that studying science gives transferable skills valuable in fields outside of traditional research. The Osmium Zone had high engagement and positive feedback from students, and a survey showed a slight increase in students wanting a job that uses science skills and knowledge.

Continue reading

Posted on September 1, 2016 by in Evaluation, Event News, News, Science Capital | Comments Off on Osmium Zone – I’m a Scientist, not just for scientists?

Demand vs. Capacity — An update for June 2016

Graph of I'm a Scientist UK class requests by event in academic year — March 2013 to June 2016 
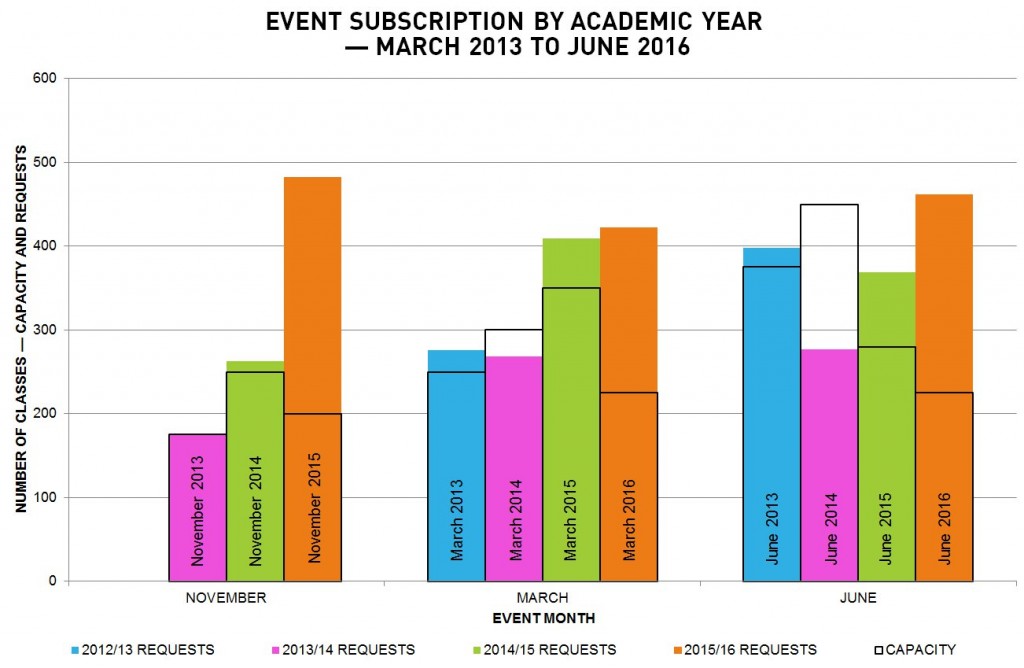
Any avid readers of our project blog — there must be at least one of you — will have noticed we’ve written a lot recently about our increasing demand for classes, and our over-subscription rates.

In January, we published some numbers. Since then we have run the March 2016 event, and finalised class places in the June 2016 event. Here are some updated numbers:

Continue reading

Posted on May 23, 2016 by modjosh in Capacity, Evaluation, IAS Event, News, Project News | Comments Off on Demand vs. Capacity — An update for June 2016

On student activity and simplified registrations

TL;DR: We made the site easier for students to access and the proportion of our audience engaging increased. Like any company, we have a set of Key Performance Indicators which we use to keep an eye on how well we’re doing. One of those KPIs (professionals use abbreviations) is the percentage of active students during an event, what we will call, %AS. %AS shows the number of students who log in to the site, and go on to — at the very least — ask a question, write a line of text in a live chat, cast a vote, or leave a comment. Basically, it shows the proportion of our audience who are actively engaging with the activity. In July 2014 Rosie posted a message on our project management app of choice, pointing out that the %AS for the previous events had been falling to the level it was at during the … Continue reading

Posted on May 23, 2016 by modjosh in Evaluation, Event News, IAS Event, News, Project News | Comments Off on On student activity and simplified registrations

Demand for classes

When we started I’m a Scientist we used our March events to allow teachers to test the event and for them to come back in June with more classes. That time after school exams when teachers looked for something to inspire kids was the ideal time. Times have changed since then. March remains popular as teachers look for activities to coincide with British Science Week, but June is no longer the most popular time of year. We think this is due to increasing numbers of schools starting the next year’s timetable and curriculum after exams and that fallow period is no longer fallow. November is where we saw some spectacular growth in 2015. We’re not sure what has driven this – we’ll investigate and we’ll rebalance when in the year we run zones. The other clear narrative from this graph is that excluding the lower than expected level of requests in … Continue reading

Posted on January 12, 2016 by ModShane in Capacity, Evaluation | Comments Off on Demand for classes

November 2015 – Bigger than ever

We’ve just published the latest batch of zone reports for the recent November 2015 round of I’m a Scientist. You can find them here, or at the bottom of this post, but before you dive into the pretty pie charts and wicked wordles, we felt it would be useful to provide some context to keep in mind as you read: We had an inkling that November’s eight zones were going to be big. As we reported beforehand, due to extremely high demand from teachers, it was the first time ever that we had to turn schools away from I’m a Scientist. We also had to limit the number of classes of those taking part to one or two per zone to fit as many schools in as possible. Without doing this we would have had to run double the number of zones to cover the demand. So, after the hype, exactly how big were the zones in November? Here … Continue reading

Posted on December 17, 2015 by in Capacity, Evaluation, Event News, News | Comments Off on November 2015 – Bigger than ever

3 words to describe a scientist

In March 2014 we started running zones for primary students only, increasing the number of primary school students who take part in I’m a Scientist. And we wanted to know more about how the event affects them.

This time, we drifted away from our usual online environment and sent printed surveys to teachers taking part in the Colour Zone and the Thulium Zone, the two primary-only zones we ran in June 2015.

We asked students which 3 words they would use to describe a scientist, before and after taking part. We got responses from over 300 students from 9 different schools. The students used more that 230 different words to describe scientists. They used 188 different words before taking part and 127 after, maybe indicating that they are clearer about what a scientist is after taking part. Awesome, cooperative, inquisitive, life-saving… are just some examples of the words they used Continue reading

Posted on November 2, 2015 by modangela in Evaluation | Comments Off on 3 words to describe a scientist

Which browsers and devices are schools using?

Every so often we take all our data, and look at how schools use the site; looking at how visitors access the site and how much that has changed in the past couple of years.  This post is for data up to 2015. See also data for 2014, 2018 and 2019. We’ve made a lot of changes in recent events, especially when it comes to registering accounts and using the site on mobile devices. We now pre-register all teachers and students, giving them usernames and passwords, so they can start asking questions immediately. We can assume that the student visitors give a fair reflection of the general school IT facilities and system capabilities. The graphs show the student data represented by dashed lines. We saw last year, that visits from mobile and tablet devices were increasing. and no surprise they continue to grow, while desktop usage drops slightly. For student tablet users … Continue reading

Posted on October 30, 2015 by modemily in Evaluation, School | Comments Off on Which browsers and devices are schools using?

Research vs Evaluation

Science Learning+ is a significant funding scheme provided jointly between the Wellcome Trust and the National Science Foundation. Learning can happen anywhere and at any time. Science Learning+ is an international initiative that aims to understand the power of informal learning experiences inside and outside of school. The second aim of the scheme is to “bridge the practice and research gap” At a seminar in July aimed at providing an update on the Phase I project an interesting conversation developed about that gap between Science Communication practitioners and researchers. I heard one speaker talk about practitioners wanting to know if a hypothetical red headline would give a 3% uplift in visitors. I responded on twitter: Disagree that practitioners want efficacy. I use eval. for that. I want research to tell me if the activity provides good outcomes #slplus — Shane McCracken (@ShaneMcC) July 27, 2015 Not all practioners agreed with … Continue reading

Posted on August 27, 2015 by ModShane in Evaluation, Science Engagement | Comments Off on Research vs Evaluation

Harwell Open Day Zone Report

On Saturday July 11th the Harwell Research Campus opened its doors to the public. 10,000 people were expected to come and see some of the most complicated and cutting edge science equipment in the world. Hundreds of volunteers working with that equipment were on hand to speak with the public and show them what happens. We created a Harwell Zone to allow visitors to text in questions. It was promoted using posters as above. The logic was that with 10,000 visitors some would not get to ask their questions, or may think of it later, or possibly be too shy to ask in person. It was a family day. Working with the over-worked (understatement klaxon just sounded) outreach team at Diamond and Harwell we set the zone up and promoted it to exhibitors. It wasn’t a great success. A mere 14 questions were sent. However in the interest of continual … Continue reading

Posted on August 24, 2015 by ModShane in Evaluation, News | Comments Off on Harwell Open Day Zone Report

Understanding Animal Research – Google Hangout

Before our most recent June 2014 I’m a Scientist event we partnered with Understanding Animal Research to run a Google Hangout for scientists who work with animals. Students often ask the scientists for their views on animal testing, and we want to help give scientists the confidence to be open and talk about working with animals in their research. John Meredith, Education Manager at UAR, ran this session with six scientists who were taking part in I’m a Scientist the following week: The A word: how to talk about animals in medical research  This informal webinar presented by Understanding Animal Research will look at how and why we should talk about animals in medical research. It will cover current public attitudes to animal research, the facts and figures, the value of openness and how to answer the tricky questions or deal with confrontation. There will be plenty of time for questions … Continue reading

Posted on August 6, 2014 by modjosh in Evaluation, IAS Event, News | Comments Off on Understanding Animal Research – Google Hangout

Wellcome Trust engaging science day

How to share and disseminate the learning from your project and evaluation. On 14th May the Wellcome Trust held one of their twice-yearly Engaging Science days. They’re an opportunity for grantholders to meet with each other and Wellcome staff, to share learning and ideas. And to sample Wellcome’s renowned lunch offerings (side salad complete with edible flowers and quail eggs, anyone?). Gallomanor were invited to speak on the panel of the session convened by Ben Johnson of Graphic Science, with the blurb “Once you have completed your project how do you widen its impact by ensuring others learn from what did (and didn’t) go right? An effective evaluation can also help with securing further funding and a wider roll-out of your project.” Other panelists were Manisha Lalloo from the Royal Academy of Engineering giving a funder’s perspective, and Becky Parker & Dave Colhurst from Simon Langton Grammar School. Evaluating the … Continue reading

Posted on May 19, 2014 by admin in Evaluation, News | Comments Off on Wellcome Trust engaging science day

I’m a Scientist zones for primary students

We’ve had plenty of primary schools take part in I’m a Scientist zones in the past, nestled in among secondary schools. Feedback from primary teachers and students shows they get a lot out of taking part. Primary schools are looking for science enrichment activities too, and talking with real scientists is exciting at primary school as well as secondary. Scientists often wouldn’t know the students were Year 5 & 6, not Year 7 & 8, if we didn’t tell them. This March we decided to run 2 primary school only zones, for Year 5 & 6 students. In part to avoid possible situations of primary students reading questions on non-primary-friendly topics asked by secondary students in their zone (think sex, drugs, rock’n’roll). Partly to open up I’m a Scientist to a wider group of UK schools and students. And importantly because one of the conclusions from the ASPIRES project about young people’s … Continue reading

Posted on April 10, 2014 by modjosh in Evaluation, News | Comments Off on I’m a Scientist zones for primary students

How does I’m a Scientist affect students’ attitudes to science?

We’re always evaluating the online STEM enrichment activity, I’m a Scientist, to explore its impact and how it can be improved. Check out latest evaluation posts. We know anecdotally that participating in I’m a Scientist has a positive effect on students’ attitudes to science. Teachers tell us that their students were buzzing, and that they understood more about science. Students thank scientists in live Chats for an interesting lesson. They tell us that it is “better than Facebook”. But, being data geeks, that isn’t good enough. We wanted to know just how much we were affecting the students. Were we affecting them all by the same amount? Girls, boys, year groups? Did being more active in the event mean a greater change in attitude? Questions we ask students Thanks in part to the pilot work by Robin Longdin (then a Science Communication masters student at UWE) we ask every student registering for I’m … Continue reading

Posted on April 9, 2014 by ModShane in Evaluation, News | Comments Off on How does I’m a Scientist affect students’ attitudes to science?

March, June or November?

When teachers ask me what aged students they should bring on I’m a Scientist, my answer is often something along the lines of “well, it’s developed for Year 9 students but all ages get something different out of taking part, so take your pick”. The good news is that our data supports this. When students register we ask them what year group they’re in. There are Year 5s. There are also Year 13s. Around two thirds of the 30,000+ students registered so far are KS3 (Years 7, 8 & 9). The bad news? It’s not really bad news as such, but it looks like I should also be advising teachers on the time of year they should take part with different year groups. March and June are great for pre-GCSE students. Teachers tell us they’re looking for something fun to do with students at the end of the year. They’re less good … Continue reading

Posted on March 14, 2014 by modjosh in Evaluation, News | Comments Off on March, June or November?

Girls vs Boys

I was asked recently what the gender split was for students taking part in I’m a Scientist. I replied that we’d never looked on the assumption that since teachers took their students online it would reflect the school population. I’m never one to turn down the chance to crunch some numbers so I took a look. And was surprised. At registration we ask if the person registering is a Boy, Girl or A group of students (where more than one pupil is sharing a log-in). We have data going back to June 2012 and nearly 15,000 respondents to the question. Surprisingly it wasn’t a straight 50:50 split. So I then decided to look at it by year group. What we saw was that year 9 & 10 were significantly skewed towards girls. And that bias continued through to 6th form. Is that common for science outreach events?

Posted on March 11, 2014 by ModShane in Evaluation | Comments Off on Girls vs Boys

I’m a Scientist so far in numbers

How many zones have we run? How many students engaging with how many scientists? Asking how many questions? What year group are they? Where in the UK are they? These are some of the questions we get asked a lot, and until now haven’t had all the answers in one place to roll off the tip of our tongues. We’re pulling together some slides summarising I’m a Scientist to date and once they’re done we’ll post them up here. In the mean time, I’ll be posting snippets that show just how far we’ve come since our first big Wellcome Trust grant in 2010. To start us off (and to set the scene for the graphs and maps to come in future posts) here are some of the numbers so far, up to February 2014: Zones: 118 51 general science zones, 67 themed zones Spread across 10 events, in March, June … Continue reading

Posted on February 14, 2014 by in Evaluation, News | Comments Off on I’m a Scientist so far in numbers

Visits to IAS by technology type

In 2014, as part of a review of what we need to do over the next 5 years with I’m a Scientist, we looked at how visitors accessed the site and how that has changed year by year over the last 4 years. We also looked at how visitors registered as students differed from All visitors. The Student visitors probably give a fair reflection of school IT capabilities. In the graphs the student data is represented by dashed lines. We only have student data from 2011 when we started tracking registered users separately. View more data up to 2019, 2018, 2015. It was no surprise to see that visits from mobile and tablet devices were increasing but having 23.6% of visits from mobile devices in 2013 was a shock. Delving deeper it is clear that it is mostly questions that mobile users visit. Tablets tell a different story. For student tablet users … Continue reading

Posted on January 22, 2014 by ModShane in Evaluation | Comments Off on Visits to IAS by technology type